
Is it possible that siblings can have different test results for their ethnicity? Why of course it is! In fact, it is normal for multiple siblings NOT to share the exact same percentage of each representative ethnic part that makes up their genetic whole. It’s about varying part to whole ratios.
It’s also the nature of autosomal DNA that makes it RANDOM – as random as getting dealt a hand of cards from multiple decks through a single shoe.
Table of Contents
Understanding the card metaphor that I use to help you easily define the how autosomal DNA works will help you understand why siblings have different test results with their DNA as well as why two related people might not show up as a genetic match.
It’s all back to the random nature of autosomal DNA. We get dealt nature’s hand in all things, and DNA is no different; however, instead of having 4 decks of cards with 208 individual cards and 16 sets of suit/value combinations, genetics (each parent) hands us more than 3 billion base pairs of DNA.
Autosomal DNA: CARDS & CHROMOSOMES (Deal Me In!)
Metaphorically speaking: 1 person = 1 deck and each (genetic chromosome) gene = 1 card. It’s not an exact metaphor as there are 52 cards within a playing card deck and there are approximately 20,000 genes (the bits that encode hereditary function) within our genetic deck. Our genes only represent about 1.5% of the total human genome, by the way.
When we are born we get dealt a full deck – well, most of us anyway and is actually the genesis of that famous pejorative statement. That means we are all born with 52 cards.
As to the composition of those cards, we get an unspecified random quantity from our mothers and an unspecified random quantity from our fathers; that is to say, we don’t necessarily get 26 from mommy and 26 from daddy (50/50).
An “unspecified random quantity” means that we don’t know which suit/value cards we are getting from each and how many cards we are getting from each, but we all get a total of 52 cards. Ceteris paribus.
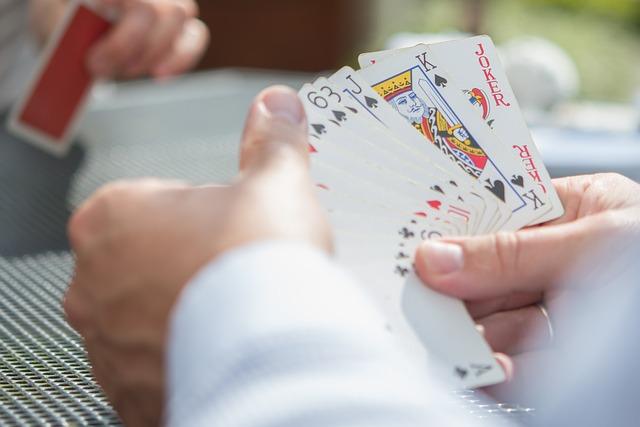
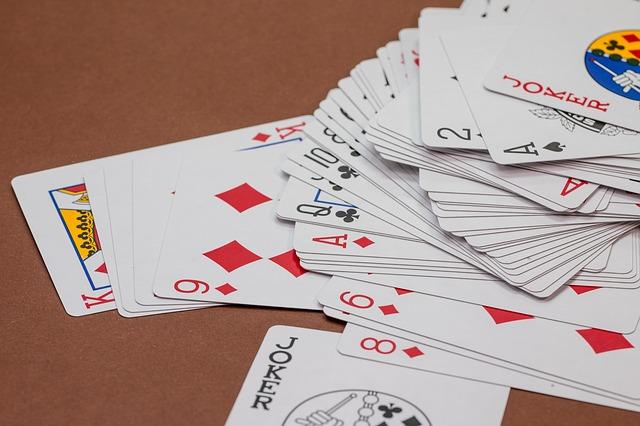
That means were all kinda born with a messy deck! We’re not all suited and in numerical order as when you purchase a brand new deck of playing cards from the store. I may have 6 aces and only one 8 and my sibling might have only one ace and six 8s, it’s all back to the randomness of autosomal DNA.
Our parents combine their decks during the miracle of life, yet mother nature decides how those 2 decks are recombined into 1; some cards are kept others are discarded. They are then shuffled and stuffed into a card shoe called you.
Autosomal DNA: DECKS & DNA (Your Hand)
Take a moment and think of the possible number of unique single decks that combining two 52-card decks can produce; while the initial numbers might not be mathematically earth-shattering, factor that along with the introduction of new decks over time and the permutations do become staggering!
The ratio of genetic material that you inherit from each parent ranges across siblings and can be 60/40, 70/30, 80/20 or almost any other permutation in between. If 4 siblings are sitting at a card table, the dealer doesn’t care if they are related, they all get randomly generated hands. Unless they are twins, of course.
How DNA is shared between family (the amounts they have in common) is measured in centiMorgans (cM). ISOGG defines a centiMorgan as: “a unit of recombinant frequency which is used to measure genetic distance” (ISOGG website) and is a great working definition here.
If we inherit an unknown percentage of cards from 2 decks to produce a single deck – also assuming that those initial 2 decks are not the same and are the result of the same process – how are we able to tell where all the cards came from? Simple, we count and match! “All right grandpa, whaddya got?”
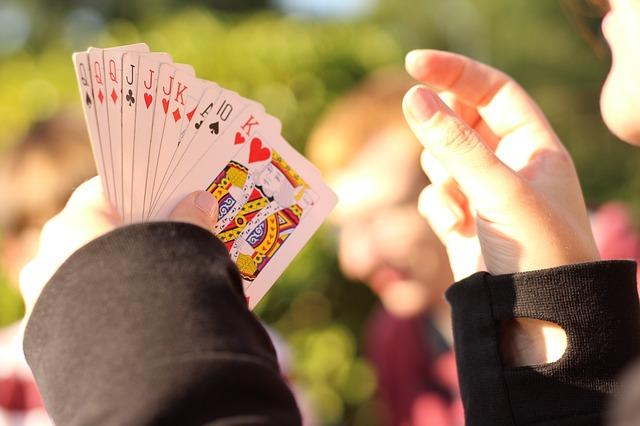
If we laid out all of our cards and compared them to the decks that our parents (grandparents) are holding, then we can see exactly where we got that king of hearts. Metaphorically speaking, of course. CentiMorgans allow us to scientifically compare our cards to the hands which our ancestors, siblings and extended family are holding.
ISOGG has a great article on autosomal DNA statistics on their site and is a go-to for many genetic genealogists.
Autosomal DNA: GENES & GAMES (Ethnicities)
Compound the ideas of cards, decks, and hands and things get even more wild when we consider that our genetic makeup is the product of different GAMES as well.
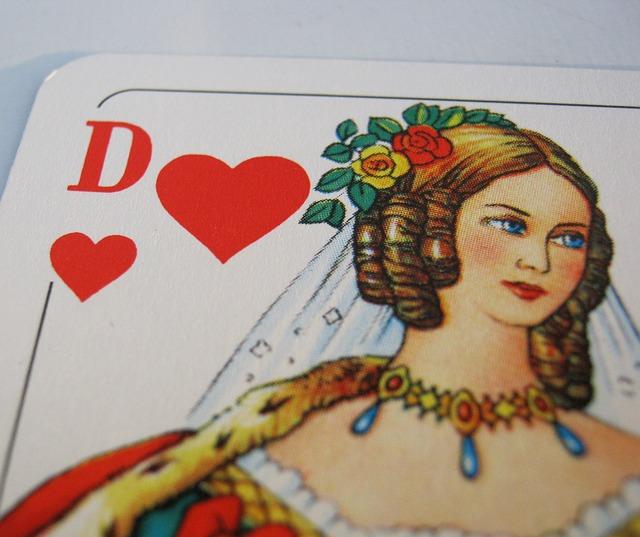
Not all decks of cards have similar designs across all nations and if we have ancestors that came from different regions, even across Europe, then we may have some unique looking playing cards differentiating our hands. We’re all “decked” out differently, get it?
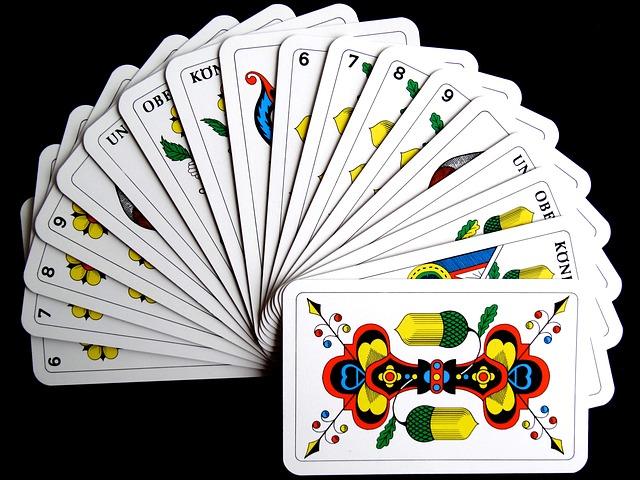
If each person has 52 cards inherited in different quantities from 2 other 52-card decks which were inherited from 4 different randomly recombined 52-card decks which came from 3 different games, then it’s no wonder that siblings will have different genetic test results, especially when it comes to ethnicity percentages.
I might be only 25% British Isles while my sister may be 50%. I might show 30% Lithuanian while my cousin might only show 15%. My deck (hand) would also have British/English-style cards in them along with Lithuanian-style cards.
Out of my “British/English” cards I will match those in my family that have those same individual cards, say a 10 of hearts. I happen to have a smiling Mona Lisa in my hand.
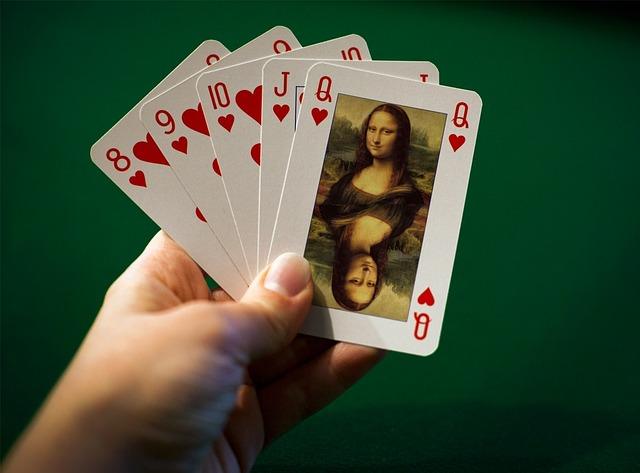
This phenomenon also explains why some extended family do not always show up on genetic test results. While I may have that 10 of hearts, my 4th cousin might not. This is definitely true in my case where I have a confirmed 4th cousin relationship through genealogy but who does not show up on my Ancestry DNA match list.
DNA tests, along with this card metaphor, are not exhaustive and should never replace actual genealogical research, it should only supplement it.
When we get our DNA test results and view them on a site like Ancestry, FTDNA, 23andMe, GedMatch, or the like, very few of our matches are close matches – at least for me. Most of my 32 pages of matches on Ancestry are distant cousins with a ‘genetic distance’ of at least +1.
But it’s that one strange, random card that has been passed down from generation to generation that we are all holding that creates that autosomal bond between us; metaphorically it may be a card that my 8x great-grandfather received and passed on all the way down to me!
Autosomal DNA: SCRATCHES & SNPs (Lineage)
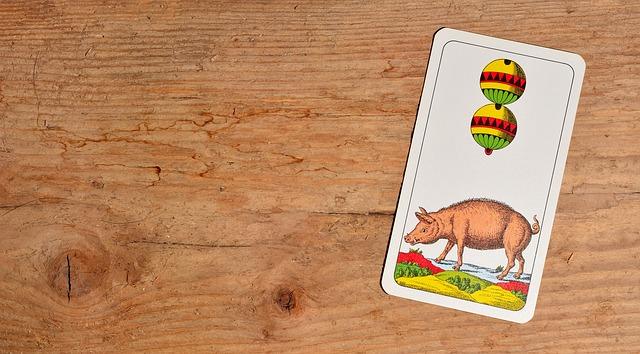
The implications on lineages and population genetics gets even more profound when you consider that accidents happen. We’ve often wanted to play cards at home with our family only to find out that the 5 of diamonds is missing, or worse scratched up. What do we do? Well, we either substitute it or mark over it.
In the study of genetic genealogy this is called an SNP, or Single Nucleotide Polymorphism.
While SNPs do not play a major role in determining your close relatives, they definitely play a determinant role in identifying your deep ancestry. SNPs are simply the switching of matched base pairs along a section of a double-helix DNA strand.
23andMe describes this phenomenon by stating that “Cells sometimes make mistakes during the copying process – kind of like typos. These typos lead to variations in the DNA sequence at particular locations, called single nucleotide polymorphisms, or SNPs” (23&Me website). They have a neat, non-scientific breakdown of the concept as far as measuring genetic relatedness through testing.
SNPs are basically useful in determining which HAPLOGROUPS we belong to. They also explain why we are related to Neanderthals and that 2.7% of Europeans still carry Neanderthal DNA!
In conclusion, and in reality, our genes choose us and we don’t get to choose them. Fortunately or unfortunately, the hype about ethnicity results is out there – this is why trendy articles make superfluous claims about one sibling being more Irish than the other. Genetically, maybe; in reality, not so much.
The ultimate takeaway in any discussion of autosomal DNA testing is that it should never replace factual, methodical genealogical research. In my mind this is what separates pure genealogy – as dates and names – from family history, or the stories and cultures of our ancestors. This is why siblings can have different test results!

Further Reading: Understanding Basic Genetics
Genetics may be one of the most underutilized resources in genealogy. While it may be a bit rigorous for some to wrap their heads around it due to the super “sciency” nature of genetics, I’ve created fun and simplified methods to make it more palatable, such as this article below which uses a BOOK METAPHOR to help you understand basic genetic parlance.
Stay Connected to Family History
Our family history is fading every day and the only person who can do anything about it is you. You are here because you are the designated family historian. Ours is a sacred purpose and the challenge is taken up daily as a part of our genealogy quest!
Every week I post new articles on The Family History foundation. I also post companion videos on YouTube and share those ideas on Pinterest. Sign up for my newsletter so you don’t miss a single moment or opportunity for you to preserve and honor your family history.
📺 Watch New Episodes Every Week on YouTube
👉 Subscribe to Family History Foundation on YouTube
Hit the 🔔 notification bell so you never miss a new episode.
📌 Save Your Favourite Research Tips on Pinterest
Interview guides, genealogy strategies, research checklists, and family history inspiration — all organised and ready to save for your next session.
👉 Follow Family History Foundation on Pinterest
📧 Join the Newsletter
Exclusive research tips, new post alerts, interview guides, and free resources straight to your inbox every week. No spam. Pure genealogy.
👉 Subscribe to the Family History Foundation Newsletter
Let’s make Family History a household word. 🏠

The Family History Foundation Newsletter
Our Family History Is Disappearing Every Day!
Join the quest with 500+ family historians getting Franklin’s Source Hound weekly research breakthroughs — real case studies, source hacks, and the exact strategies that turn brick walls into discoveries.
Free. No fluff. Straight from the Source Hound’s desk to yours.
Your privacy is sacred — almost as sacred as a primary source. Read our Privacy Policy.
Shop Premium Genealogy Forms
Q: How much DNA do full siblings share with each other?

Full siblings share approximately 50% of their DNA on average (typically ranging between 37.5% and 54%). However, variances can range between 20-80% of their DNA from their mother and 20-80% from their father. The Card Metaphor helps to understand autosomal DNA concepts.
Why do my sibling and I have different ethnicity estimates?
Ethnicity estimates analyze specific genetic markers passed down from ancestors. Because each sibling inherits a different, randomly shuffled half of each parent’s DNA, one sibling might inherit a distinct regional marker (e.g., Scandinavian or Native American) that the other sibling simply did not receive.
Why does my sibling match a distant cousin on a DNA site while I do not?
Distant relatives share very small, isolated segments of DNA. If a parent carries a small DNA segment inherited from a 4th great-grandparent, that parent has an approximate 50/50 chance of passing that specific segment to any given child. If Sibling A receives it and Sibling B does not, only Sibling A will match that distant cousin.
Do differing ethnicity results mean we might actually be half-siblings?
Varying ethnicity percentages are completely normal for full siblings and do not indicate a half-sibling relationship. Biological relationships are measured by total shared DNA (measured in centimorgans, or cM), not matching ethnicity estimates. Full siblings typically share between 2,200 cM and 3,400 cM, whereas half-siblings share significantly less (1,300 cM to 2,300 cM).
How do testing platforms use reference panels to assign regional ethnicity percentages?
Testing platforms analyze thousands of Single Nucleotide Polymorphisms (SNPs) across an individual’s autosomal chromosomes and run computational algorithms to compare those markers against reference panels. Reference panels consist of genetic samples from modern populations whose families have documented deep roots in a specific geographic region. Because parental SNP configurations are randomly recombined and dealt to each child, each sibling carries a distinct set of regional markers, resulting in varied percentage assignments when evaluated against reference panel baselines.



Visitor Rating: 5 Stars
Visitor Rating: 5 Stars
Visitor Rating: 5 Stars
Visitor Rating: 5 Stars
Visitor Rating: 5 Stars